SAMPLE LABS
A collection of labs performed in Mechanical Engineering Laboratory I, intended to demonstrate fundamental engineering concepts in an experimental settings. Various photos from each lab as well as the experimental abstract from each group lab report are provided below.

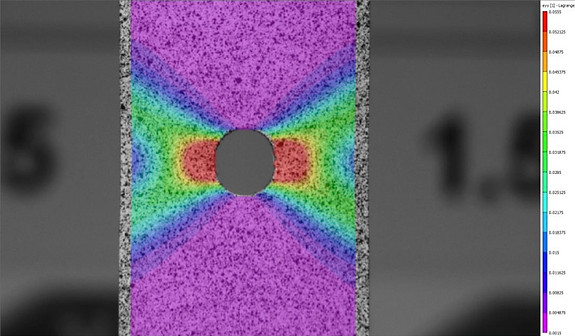
Stress distribution along non-homogenous sample
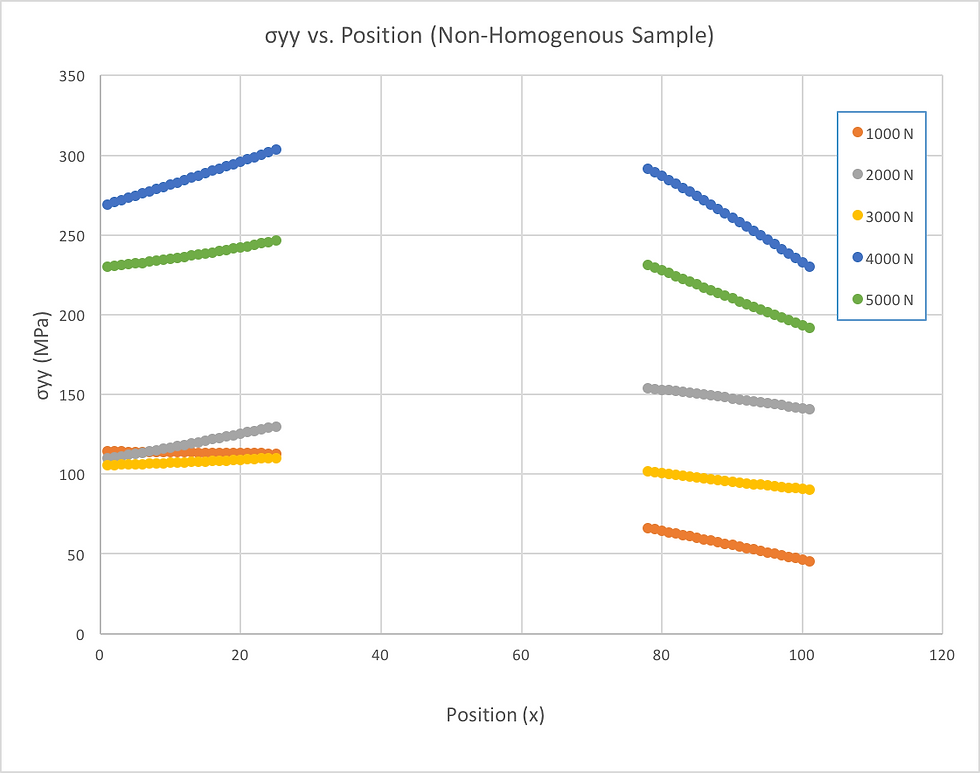
Stress along position of non-homogenous dog-bone sample at various force loads
MECHANICAL PROPERTIES
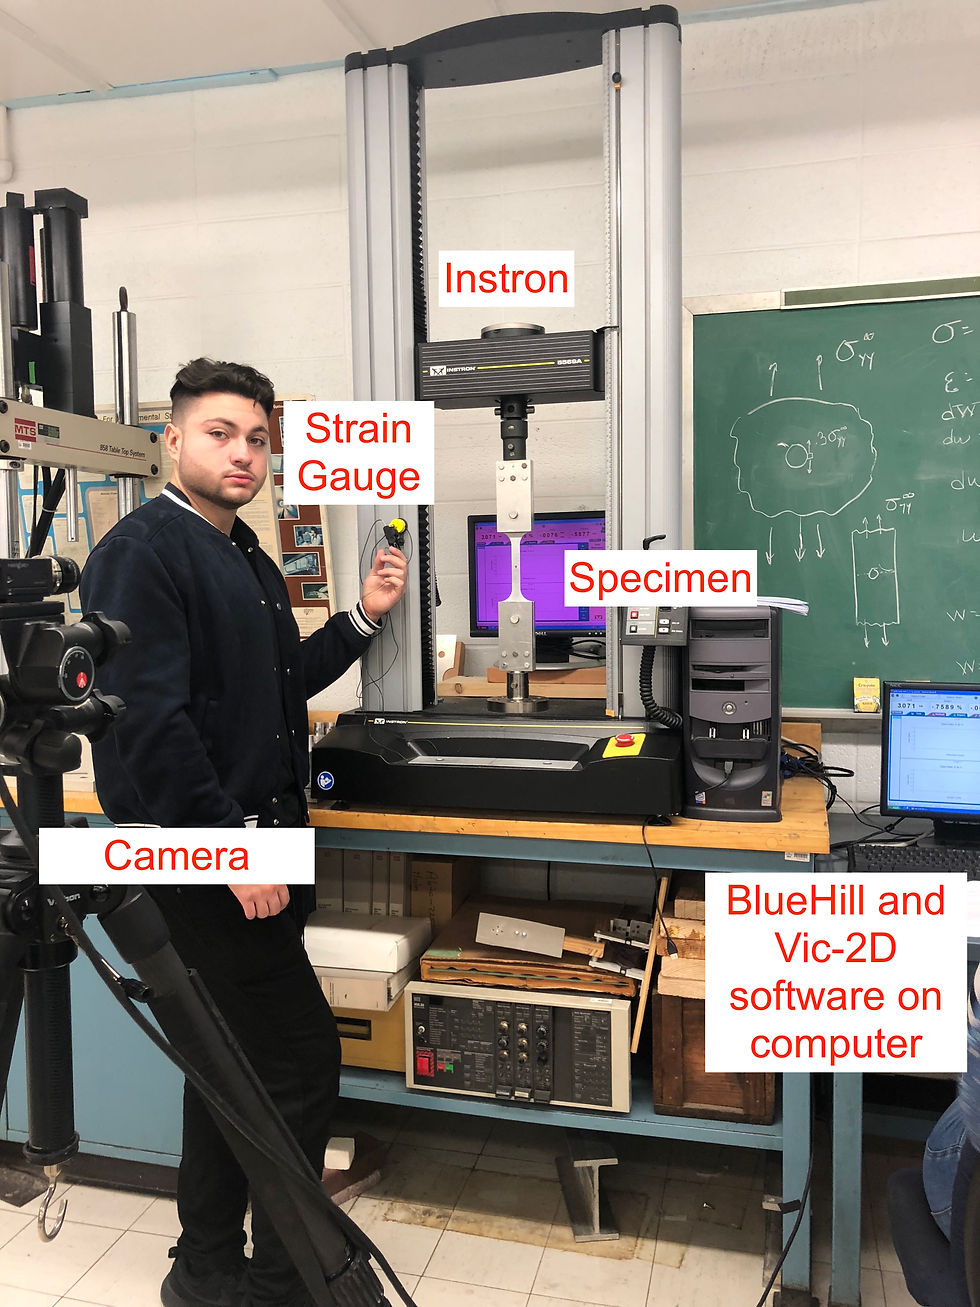
This lab has objectives of measuring the uniaxial stress vs. strain response of an aluminum alloy dog-bone specimen, extracting mechanical properties from the data, measuring the spatially-resolved strain field in the specimen using DIC and comparing to the average strain field measured with the standard clip-on strain gauge used on the Instron and measuring the stress concentration factor associated with a circular hole in an aluminum dog-bone specimen. The homogeneous dog-bone was calculated to have a Young's Modulus of 51.513 GPa, a yield strength of 220.27 MPa, and an ultimate tensile strength of 233.76 MPa. The average spatially resolved strain field of the homogeneous sample is found to be Eyy = 0.0855 and Exx = -0.0297 using DIC analysis. This is close to the maximum spatially-resolved strain gauge measurement of 0.032. A non-homogeneous sample of Aluminum 6061 containing a circular hole at its center is then subjected to this procedure to determine if the stress concentration at the material's discontinuity is greater than that of a remote point. This sample is analyzed to determine the maximum load it can sustain while still under linear elastic deformation, or the proportional limit. Strain data is analyzed at all points along a horizontal line bisecting the circular discontinuity at each 1000 N load increment before the proportional limit, and this strain data is used to determine the stress at points both distant and at the hole's edge. The ratio of stress close to the hole to stress distant from the hole, or the stress concentration factor, at the hole's edge should be equivalent to that of an infinite plate with an elliptical hole, 3. This is confirmed by finding the normalized stress at points closest to hole at each load level.
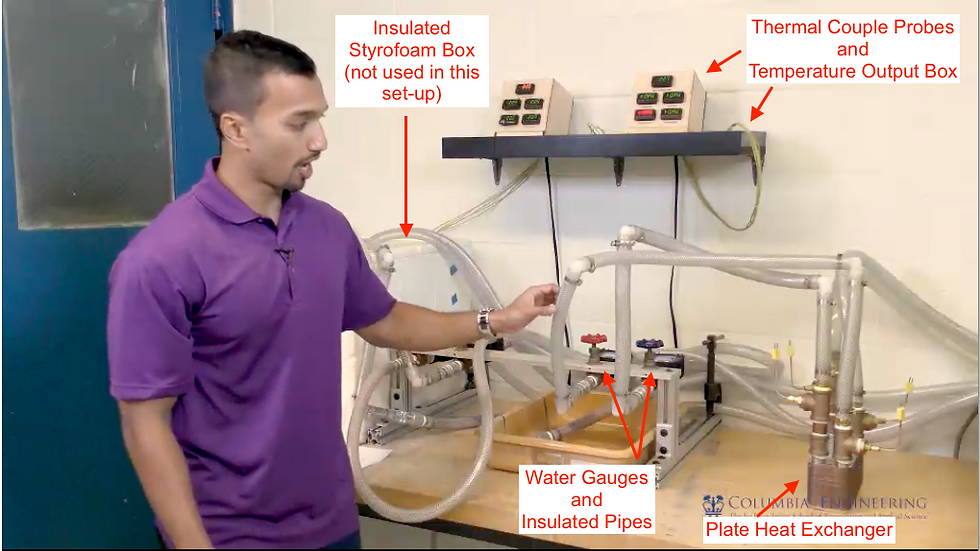
Experimental Configuration of parallel plate heat exchanger Source: Columbia University Department of Mechanical Engineering

Source: Columbia University Department of Mechanical Engineering

Source: Columbia University Department of Mechanical Engineering
Experimental Configuration of parallel plate heat exchanger Source: Columbia University Department of Mechanical Engineering
HEAT TRANSFER
In this laboratory, the first objective of validating the First Law of Thermodynamics is tested by measuring temperatures of hot and cold water entering and exiting a heat exchanger in parallel and counter flow arrangements. These temperatures are measured using thermocouples and then used in calculations along with flow rates measured with EZ-View flow meters to find heat transfer rates. The parallel configuration yielded hot and cold fluid heat transfer rates (Qc and Qh) of 17.01 ± 4.00 and -15.23 ± 2.34 kW respectively. The counter flow configuration yielded Qc and Qh of 24.68 ± 5.68 and -22.48 ± 2.99 kW respectively. The absolute values of these rates are proven statistically different using a two-sample t-test for both configurations and therefore did not validate the 1st Law of Thermodynamics. This is most likely due to the fact that the system was not completely adiabatic and as a result there was heat transfer between the air and water. The high error values, however, are also a sign that the First Law of Thermodynamics is in effect. The second objective was to find the effectiveness of the two configurations. The parallel configuration had an effectiveness of 45.736 ± 17.503% for the cold flow and 40.963 ± 13.694% for the hot flow. The counter flow configuration yielded and effectiveness of 63.026 ± 24.696% and 57.386 ± 16.474% for the cold and hot flow respectively. As the counter flow configuration experiment had higher effectiveness, it is in line with the First Law of Thermodynamics.

Source: Columbia University Department of Mechanical Engineering
Source: Columbia University Department of Mechanical Engineering
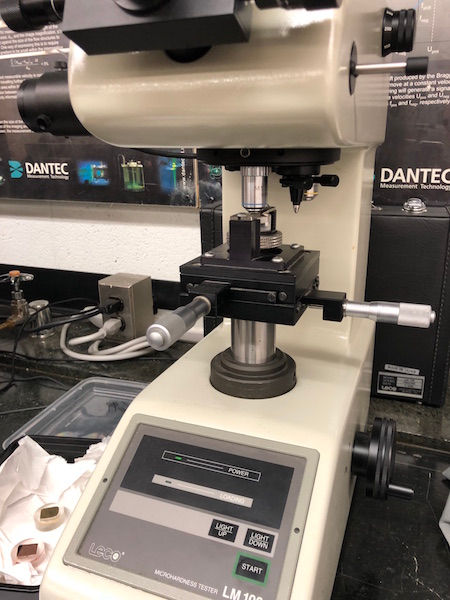
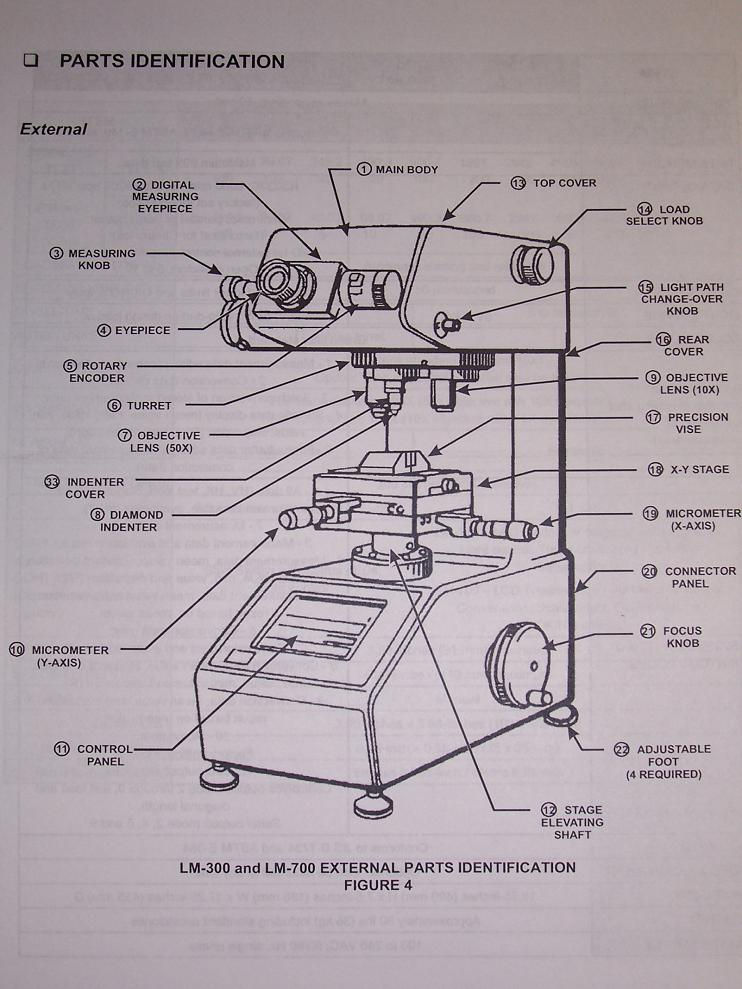
HARDNESS TESTING
This lab has two main objectives of relating hardness to yield strength and of using an ANOVA test to validate hardness calculation procedures. This is done by testing four different materials: Aluminum 6061, Copper 182, Brass 360, and Low Carbon Steel. A Vickers Microhardness tester and ConfiDent software are used to find the values of the hardness of each material by indenting the material and analyzing its size relative to the force applied. The aluminum is tested at three different forces to make sure that the hardness testing is accurate and that it does not depend on force. The calculated hardness values are 633.51 ± .01% for Aluminum (F = 500 GF), 664.89 ± .01% for Aluminum (F = 300 GF), 668.81 ± .008 % for Aluminum (F = 200 GF), 1260.15 ± .01% for Brass 360 (F = 500 GF), 2532.08 ± .01% for Low Carbon Steel (F = 500 GF), and 1610.25 ± .01% for Copper 182 (F = 500 GF) (All values in MPa). An ANOVA test performed on the data from the aluminum sample originally showed that the hardness values were not equivalent, but upon reevaluation, it showed otherwise. The yield strength for each material was extrapolated from given data. When the hardness values were graphed against the yield strength values it showed that there was a strong linear relationship.
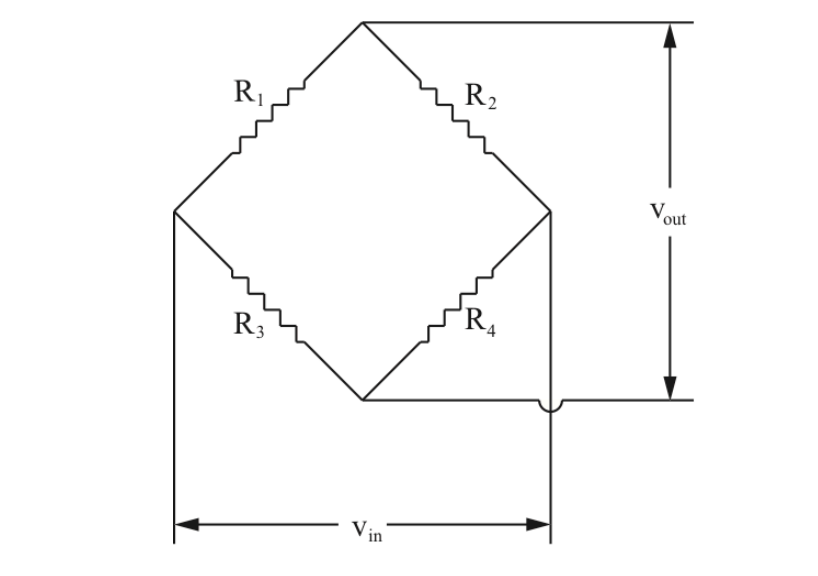
Wheatstone Bridge as used to convert resistance readings to voltage readings as form of measuring strain response. Source: Columbia University Department of Mechanical Engineering
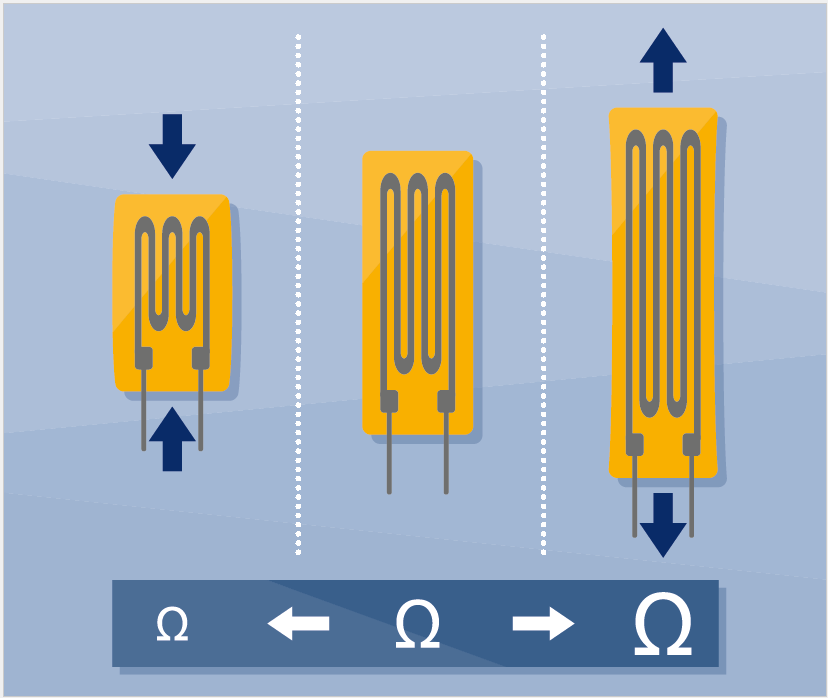
Source: Thomas Kleckers. How does a Force Transducer Work?— Working Principle— HBM
Source: Columbia University Department of Mechanical Engineering
Wheatstone Bridge as used to convert resistance readings to voltage readings as form of measuring strain response. Source: Columbia University Department of Mechanical Engineering
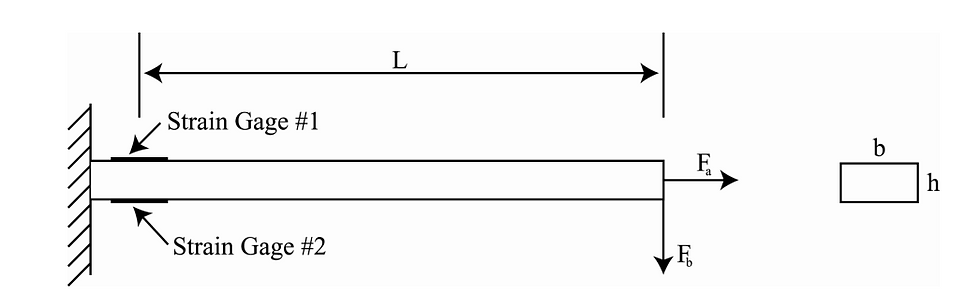
FORCE TRANSDUCER
In this experiment, a force transducer is created using an Aluminum 6061 cantilever beam with two Vishay strain gauges attached to its top and bottom faces. The end fastened with the strain gauges is clamped to work table and the opposite end is loaded with various pipes suspended from a string, each pipe belonging to one of two samples machined on separate mills. The change in length (and therefore strain) in the beam due to each pipe is measured as a change in electrical resistance by the strain gauges, and is furthermore converted to a voltage registered through a Wheatstone Bridge in the Vishay Amplifier. This voltage data is translated for the computer using a data acquisition (DAQ) chip, converted into bending force using the LabView program, and finally converted to mass by dividing each force data point by the gravitational constant (9.81 kg). The average force of Set 1 is found as 8.909 ± 0.2 N with a standard deviation of 0.113 and the average force of Set 2 is found as 8.806 ± 0.2 N with a standard deviation of 0.089. A two-sample t-test is performed on these sets which finds no significant difference in the forces of each set, therefore determining that both sets have statistically equivalent masses. Uncertainty analysis of both relative and systematic uncertainties furthermore shows that an overall relative uncertainty of 2.14% (± 0.200 N). Compared to the ± 0.02% Fnom relative error of the Model F3833 tecsis bending load cell, this is reasonable uncertainty for a force transducer. \cite{data} Though the average mass of the pipes using the Honeywell load cell is 958.8 ± 6 grams compared to 902.9 ± 20 grams using the force transducer, it should be noted that the length, base, and height of the beam used in the Labview calculation belonged to another group and were not reflective of the beam used in the actual experiment.